
Dashboards that answer real business questions
Connect, explore and visualise data so people can understand performance, investigate what changed and make better-informed decisions.
A dashboard is only useful when people trust what it means
Tableau is Salesforce’s analytics portfolio for connecting to data, exploring it and sharing visual insight. The portfolio includes Tableau Desktop, Tableau Cloud, Tableau Server and Tableau Next, with different deployment and agentic analytics capabilities.
Art of Cloud helps organisations move from a collection of charts to a governed analytics experience. We define the decisions and measures first, then connect the right sources, resolve metric definitions and design dashboards around how different audiences use information.
We are equally interested in what happens after someone sees the insight. Where appropriate, Tableau can connect with Salesforce, Slack and wider workflows so teams can discuss or act without losing the meaning and governance behind the data.
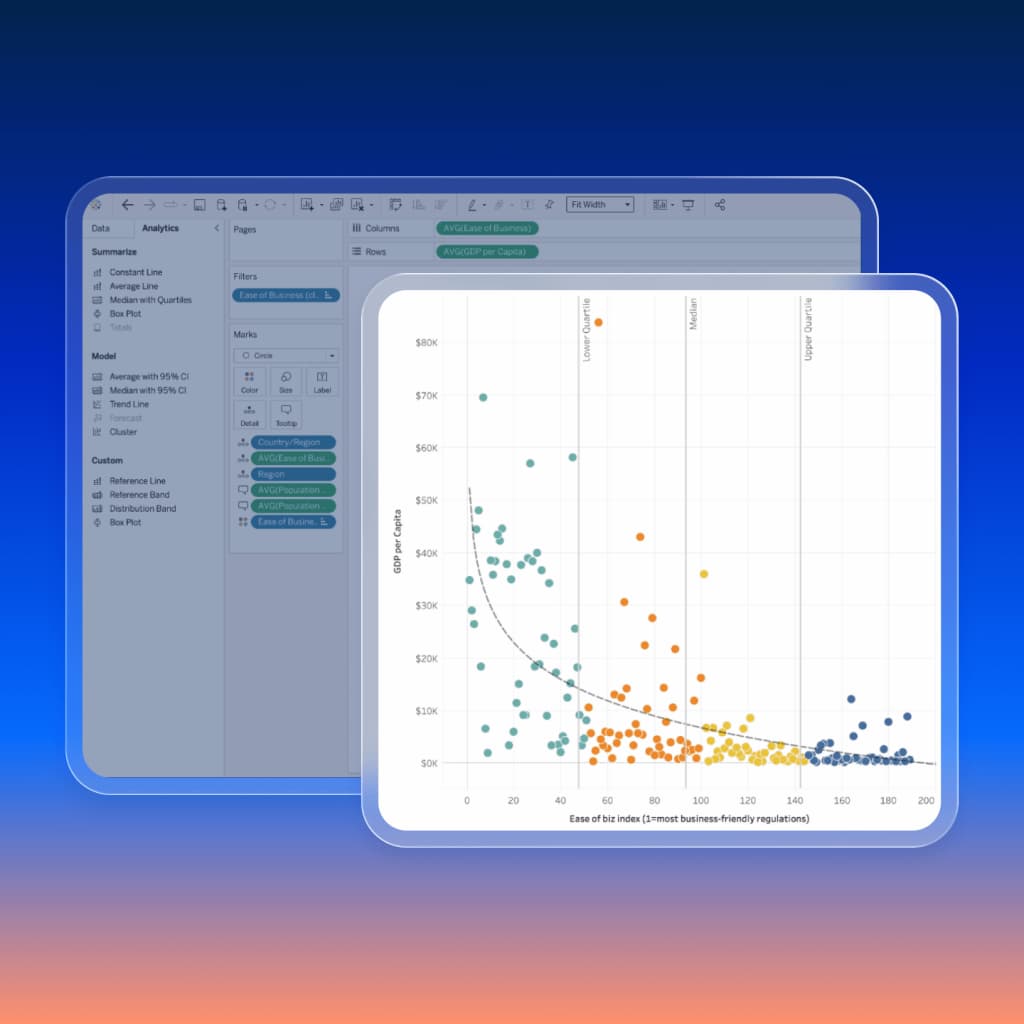
What you can expect
Trusted analytics with clear measures, appropriate access and dashboards designed for decisions rather than decoration.

Questions before visualisations.
We define what users need to understand, compare, monitor or decide before selecting chart types or layouts.

Data connected with clear lineage.
We identify sources, transformations, refresh timing and system-of-record boundaries so users know where the numbers came from.
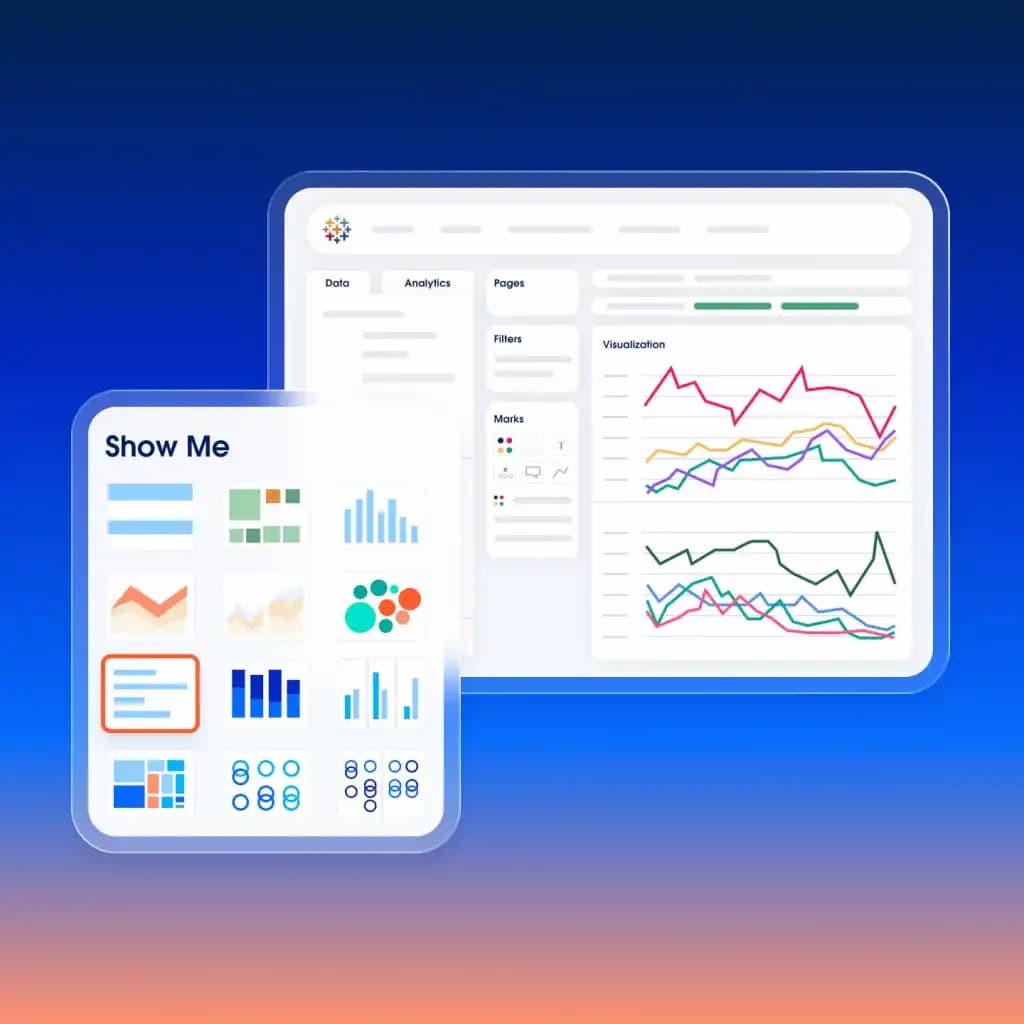
Dashboards built for the audience.
Executives, managers and analysts often need different levels of detail, interaction and explanation.
What can Tableau help you do?
The chosen Tableau product and licence determine the available features. Common uses include:
- Connect to files, databases, warehouses and business platforms
- Prepare, combine and model data for analysis
- Build interactive dashboards and visualisations
- Monitor KPIs, trends, exceptions and targets
- Explore data through drill-down and filtering
- Share governed analytics through Tableau Cloud or Server
- Embed insights in Salesforce and other applications
- Deliver alerts, subscriptions and insight into Slack
- Support conversational and agentic analytics with Tableau Next
- Establish analytics governance, ownership and content standards
How we deliver Tableau analytics
1.
Define the decisions. We identify audiences, questions, measures, actions and the existing reporting problems.
2.
Agree the data. We map sources, ownership, quality, calculations, refresh needs and security.
3.
Prototype the experience. We design and test dashboard structure with representative users before scaling the build.
4.
Build and validate. We create the data and visual layers, reconcile outputs and test filters, access and performance.
5.
Publish and govern. We establish ownership, certification, permissions, refresh monitoring and content lifecycle.
6.
Adopt and improve. We train users and use feedback and usage evidence to refine the analytics estate.
Still have questions?
Let’s answer them
What is Tableau?
Tableau is an analytics platform for connecting to data, exploring it and sharing visual insights. Its portfolio includes desktop, cloud, server-hosted and newer agentic analytics products.
Does Tableau only work with Salesforce data?
No. Tableau connects to a wide range of files, databases, warehouses and applications. Salesforce data can be combined with other authorised sources where the model and governance support it.
What is Tableau Next?
Tableau Next is Salesforce’s newer agentic analytics product, designed to deliver proactive and conversational insights into experiences such as CRM and Slack. Availability and fit depend on the current product packaging and data architecture.
Is Tableau the same as Salesforce reports and dashboards?
No. Standard Salesforce reporting is well suited to many operational CRM needs. Tableau supports broader data sources, deeper exploration, advanced visual analytics and enterprise analytics use cases. We recommend the simplest tool that answers the requirement.